 By Michael McCann
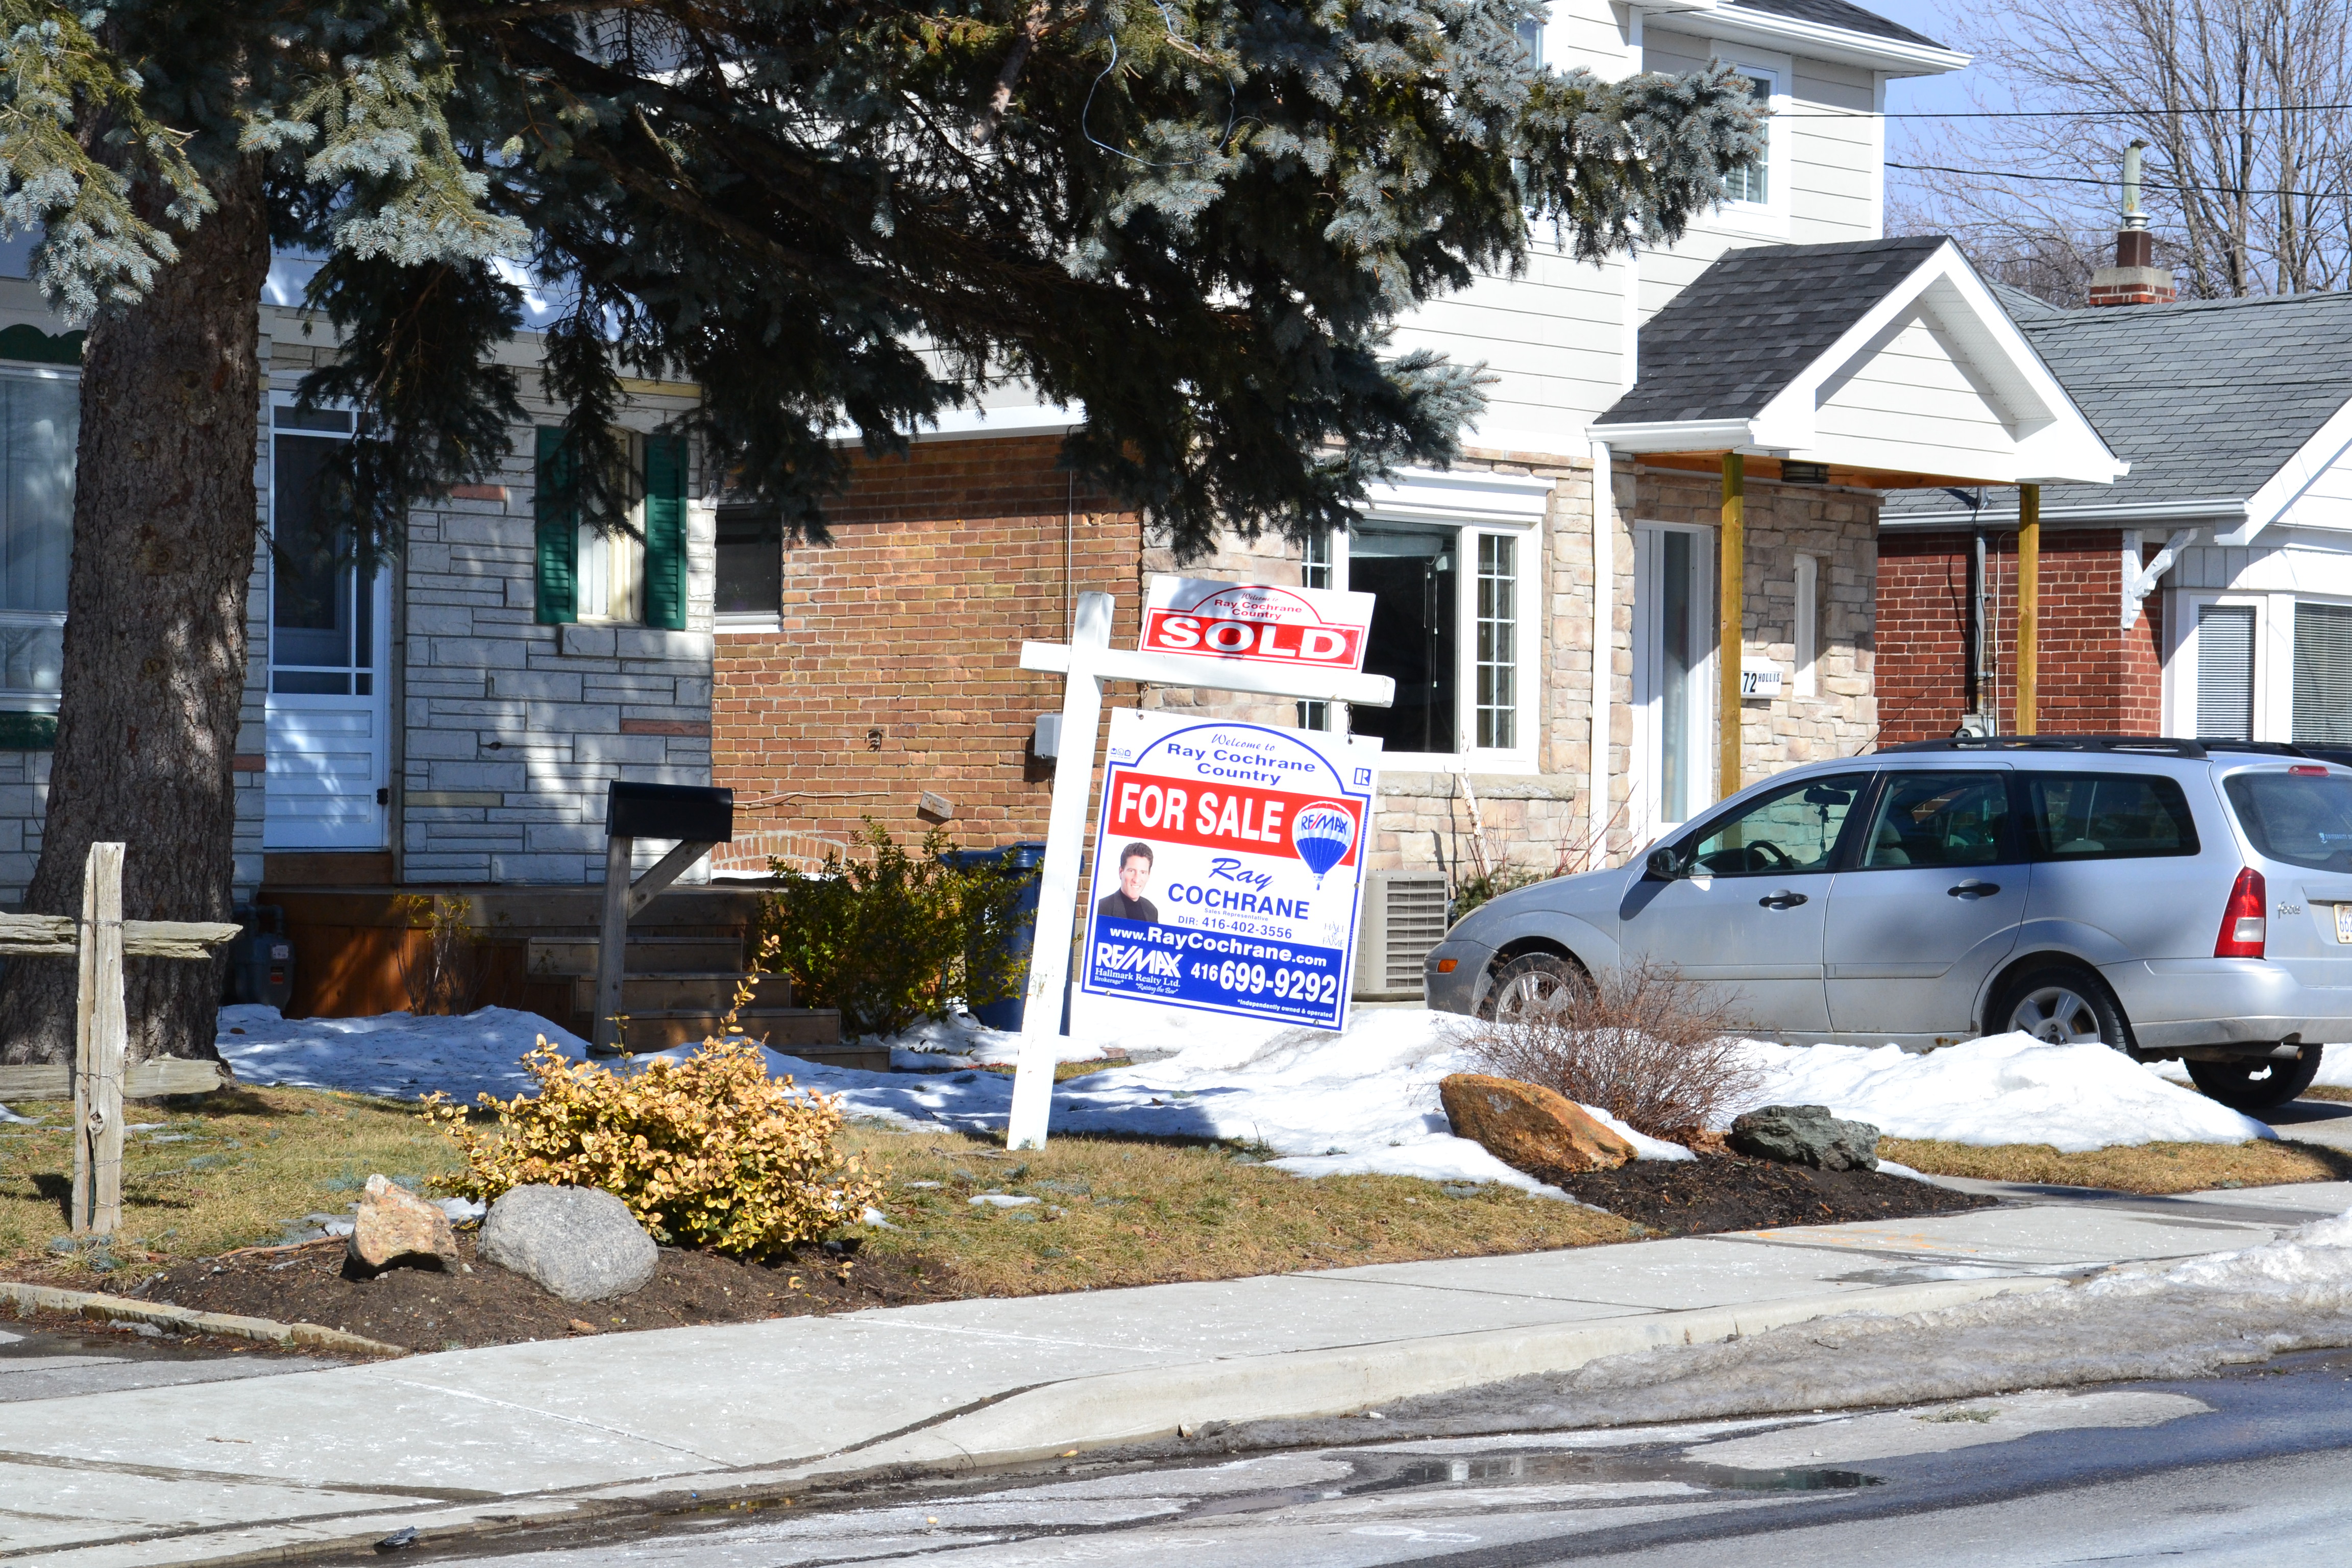
Statistics are out for the first month of 2013 so let’s see how they compare to last year’s real estate numbers.
Thirteen homes were sold in Birchcliff/Cliffside in January with an average price of $437,773. The average number of days on market was 18.
In January 2012, Birchcliff/Cliffside saw 18 homes sold, with an average price of $435,689, taking an average of 19 days to sell.
30% drop in volume since Jan. 2012
Statistically, the average price this year compared to last year is almost the same (a minor drop in price of -1.7%).
The data which jumps out at me, however, is that the number of sold homes went from 18 last January to 13 this year — a drop of almost 30%. There are definitely fewer homes for sale in our neighbourhood and the ones that are selling show well and are priced at their true market value.
Let’s look at the bigger picture by comparing the neighbourhood stats to all the detached homes that sold in Toronto East, which includes roughly the area east of the Don Valley to the Rouge River. There were 221 sales in Toronto East with an average price of $514,473 taking an average of 21 days to sell.
Gazing in the crystal ball
So what do I think the next couple of months will bring us? If our numbers are similar to February and March of 2012 our average days on market should drop to 12 – 15 days and average price should come in anywhere between 10 to 12 percent higher than January 2013.
I can tell you that my buyers are certainly tentative about putting in offers, so my advice to anyone considering selling is as follows:
- Don’t get greedy and overprice your home unless you enjoy months of people parading through.
- Not considering offers for a week is a strategy which will fail as today’s buyers aren’t dancing to that tune.
Our local spring housing market will be busy and over the next three months and I suspect we will sell 100 houses within the Birchcliff/Cliffside neighbourhood. This has always been a strong period for home sales but I suggest you take the above advice and can save yourself a lot of frustration.
Birch Cliff – Cliffside Home Sales in January 2013 – 18 homes sold
Source: Toronto Real Estate Board all sold homes excludes commercial properties, condos and vacant land
For a look at local real estate prices over the last six months, click on the tabs.
[tabs slidertype=”top tabs”] [tabcontainer] [tabtext]December[/tabtext] [tabtext]November[/tabtext] [tabtext]October[/tabtext] [tabtext]September[/tabtext] [tabtext]August[/tabtext] [tabtext]July[/tabtext] [/tabcontainer] [tabcontent] [tab]Birch Cliff – Cliffside Home Sales in December 2012 – 11 homes sold [/tab] [tab]Birch Cliff – Cliffside Home Sales in November 2012 – 27 homes sold [/tab] [tab]Birch Cliff – Cliffside Home Sales in October 2012 – 19 homes sold [/tab] [tab]Birch Cliff – Cliffside Home Sales in September 2012 – 19 homes sold [/tab] [tab]Birch Cliff – Cliffside Home Sales in August 2012 – 27 homes sold[/tab] [tab]Birch Cliff – Cliffside Home Sales in July 2012 – 22 homes sold[/tab] [/tabcontent] [/tabs]
According to the Toronto Real Estate Board, our local housing market is defined as Birch Cliff/Cliffside and the boundaries can be seen below.
View Birch Cliff / Cliffside in a larger map

